Traffic is not what it used to be. For a decade, more sessions meant more opportunity, and a rising traffic chart on a Monday morning felt like progress. That relationship has been loosening for years, and AI search has now broken it almost entirely for a large class of buyer journey.
Vanity metrics are numbers that look good on a report and have no reliable connection to business outcomes. Website traffic has become the most widely reported example.
What makes a metric a vanity metric
A metric earns the label when it can be improved without improving the business, and when it can look healthy while the business is declining.
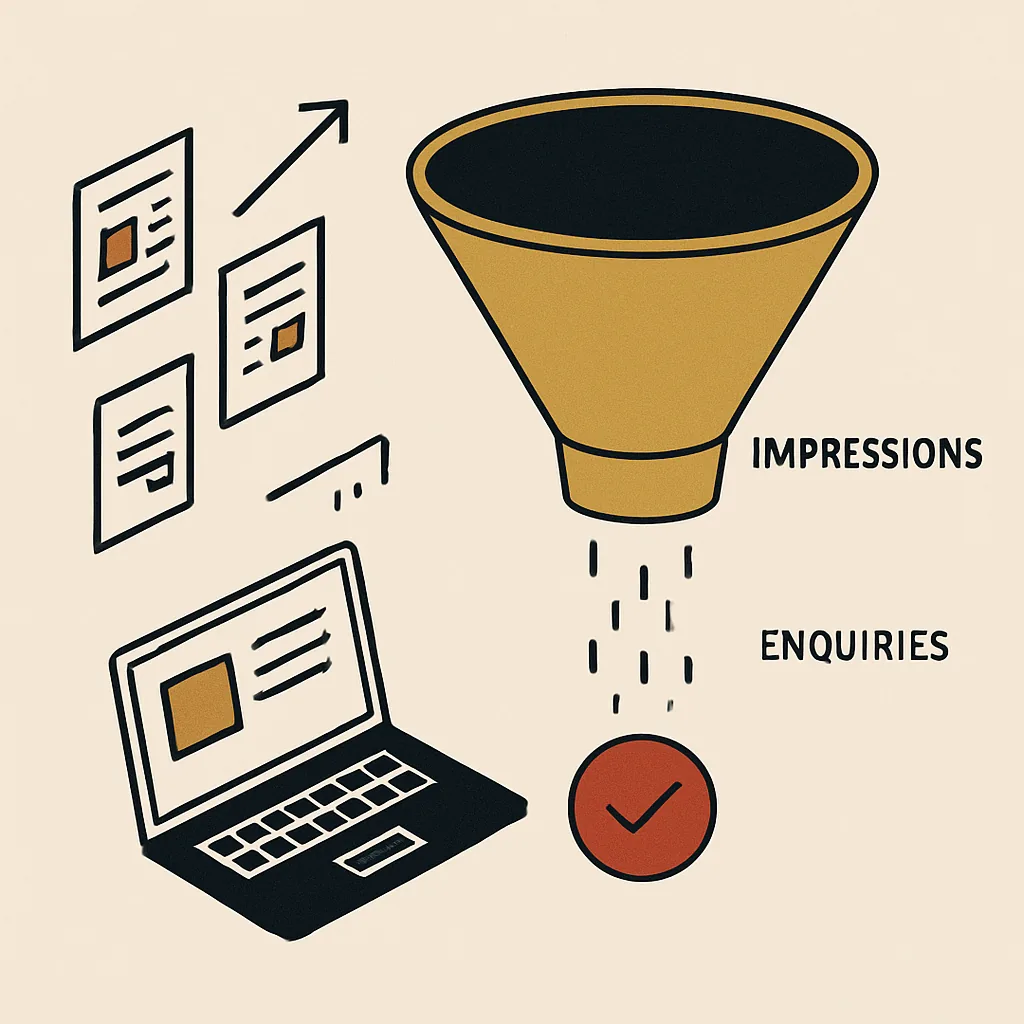
Traffic passes both tests. You can double sessions by broadening your keyword targeting to capture informational searches from people who will never buy from you. The chart goes up; enquiries stay flat or fall. You can improve rankings for high-volume terms that attract the wrong audience entirely. Traffic rises; revenue does not follow. The metric reports success while the underlying problem deepens.
This is not a subtle distinction. The businesses that make good decisions about their online presence are the ones that build a discipline around measuring outcomes, not inputs. Sessions and impressions are inputs. Enquiries from commercially relevant searches are outcomes.
The question your leadership team should be asking is not “how much traffic did we get?” It is “how many of the right people found us, and what did they do when they got here?”
Why the gap between traffic and revenue is wider now
The mechanism that made traffic a reasonable proxy for opportunity was simple: you ranked, people clicked, some bought. The click was the link between visibility and revenue.
AI search engines have broken that link for a significant and growing segment of buyer behaviour. When someone asks ChatGPT “who should I hire for X in Y city,” the engine names three to five businesses in its answer. There is no list of links to click through. There is a recommendation, and a decision follows from it.
The businesses named in those answers are being shortlisted. The businesses not named are invisible to that buyer, at that moment, whether they rank on the first page of Google or not. And the session never happens. The traffic never arrives. Your analytics show nothing.
This is why a monthly activity report can look completely healthy while an entirely separate discovery channel is naming your competitors and ignoring you. Traffic measured monthly is noise. Citation rate across AI engines, measured quarterly, is signal.
What to measure instead
The replacement metrics are less satisfying to a dashboard designer because they are harder to automate. They require human judgement to collect and interpret. That is, in part, why most agencies continue to report traffic: it is easy to pull from a platform and paste into a slide.
The metrics worth tracking for a business that sells professional services, specialist skills, or knowledge-intensive work are:
Enquiry volume from organic and AI search. Not sessions, not rankings. How many people who found you through search or AI answers got in touch? Track this by source if your intake process allows it.
Conversion rate by landing page. If a page receives a thousand sessions and generates no enquiries, the page is not working regardless of its ranking. A page that receives two hundred sessions and generates twelve enquiries is performing. Session volume without conversion data is the dashboard equivalent of a calorie count without a nutritional label.
Citation rate across the main AI engines. Ask the questions your customers ask, across ChatGPT, Claude, Perplexity and Google AI Overviews. Record whether you are named, and where. A Visibility Briefing, our diagnostic entry-point engagement, produces this baseline for you, measured properly, across all four engines. Most businesses that have never done this work discover their citation rate is zero or close to it. That is not a traffic problem. It is an entirely different problem that no amount of optimising for sessions will solve.
Competitor citation rate. Who is being named instead of you? This is the information that changes strategy fastest. If a direct competitor is named in eight out of ten relevant AI answers and you are named in zero, you have a specific, solvable problem with a measurable gap to close. A Visibility Briefing maps this as part of the baseline.
Qualified enquiry rate, not total contact volume. Five enquiries from buyers who can afford you and have a real problem you solve are worth more than fifty enquiries from people who are not a fit. The metric is quality-adjusted enquiry volume. Everything upstream of it, including traffic, is overhead.
The metrics that matter: what the funnel actually looks like

Consider the stages a buyer actually passes through before they contact you.
They form a need. They ask a question, either in a search engine or an AI engine. They are presented with options, either a list of links or a named shortlist. They evaluate. They contact one.
Traffic measurement only captures what happens after the click. It misses the entire AI engine channel, where the shortlisting happens before the click, and often instead of it. A business that is being named consistently in AI answers and not named in Google results will show low traffic numbers and healthy enquiry numbers, and a traffic-focused report will describe this as a problem requiring more SEO investment.
A business that ranks well on Google but is absent from AI answers will show healthy traffic and may be seeing a slow, invisible decline in the share of enquiries that come from buyers who used AI to shortlist. There is no alert. Nothing breaks. The traffic number stays up.
The correct response to this is not to stop tracking traffic. It is to stop treating traffic as the headline metric. It goes in the appendix. The headline is: how many commercially relevant buyers found us this quarter, across all the channels they use, and what did they do?
How to change what you report
Most marketing reporting is built around what is easy to extract from the platforms that generate it. Google Analytics exports sessions. Search Console exports impressions and clicks. These numbers go into the report because they are there, not because they are the most useful.
Changing what you report requires deciding in advance what outcomes matter and building backward from there to the leading indicators worth tracking. For most of the businesses Qyliq works with, the hierarchy looks like this:
- Qualified enquiry volume (the outcome)
- Citation rate across AI engines (the AI discovery leading indicator)
- Organic search click-through on the pages that generate enquiries (the Google search leading indicator)
- Everything else: traffic, impressions, rankings, sessions (context, not signal)
A quarterly evidence cycle, rather than a monthly activity report, is the structural change that makes this possible. Monthly reporting rewards short-term movement in easy-to-move metrics. Quarterly reporting rewards real change in the indicators that matter. Three to four rounds across a year produce a documented record of what changed, what caused it, and what to do next. That is the kind of record a director can present to a board or use to evaluate whether the investment is working.
The practical consequence of tracking the wrong thing
When a business reports on traffic and rankings as its primary metrics, the decisions it makes are shaped by those metrics. More content to drive more traffic. More links to improve rankings. More keywords to capture more impressions.
None of that work is useless. But when it is done without asking “is this producing enquiries from buyers we want?”, it becomes expensive activity with uncertain returns. The agency produces a report showing improvement. The business cannot connect the improvement to revenue. The relationship eventually breaks down.
This is the shape of a large fraction of agency relationships in the UK market right now. It is not primarily a question of competence. It is a question of which metrics are being used to define success.
Changing the metrics changes the decisions. Reporting on citation rate across AI engines means investing in the work that improves it: making your business information consistent, clear and well-structured across every source an AI engine reads. Reporting on qualified enquiry volume means evaluating every piece of content by whether it attracts buyers who can actually work with you.
The shift is from measuring how visible you are to measuring how findable you are by the right people, through the channels those people actually use.
What this means in practice
If you are currently reporting traffic as a primary metric, you probably already suspect the number is telling you less than it used to. The searches that used to drive sessions are being partially intercepted by AI engines. The buyers who used to click through are sometimes making their shortlist decision before they leave the AI answer.
The right response is not to panic and change everything. It is to add the missing measurement layer. Establish your citation rate baseline across the main AI engines. Pair it with your enquiry data. Review both quarterly, not monthly.
A Visibility Briefing is the entry point for this. It audits what ChatGPT, Claude, Perplexity and Google AI Overviews currently say about your business, measures your citation rate against commercially relevant queries, maps where competitors are being named instead of you, and produces a briefing that tells you what to fix first. It is diagnostic rather than prescriptive: you see the evidence before committing to any ongoing work.
Traffic will still be on the report. It will just no longer be the number you lead with. The number you lead with is how many of the right buyers found you, across every channel they used. That is a harder question. It is also the right one.
If your current reporting cannot answer it, Request a Visibility Briefing and we will show you exactly where you stand. You can also read how we structure the quarterly evidence cycle, see how quarterly reporting compares to the monthly activity report, or review what gets included in a proper AI visibility audit.